- Published on
Boost Solution Performance by Knowing What Your Software is Running On
- Authors

- Name
- Nathan Peper
- @nathanpeper


When developing software, understanding the system on which your software runs is paramount. By tapping into hardware and system details, developers can tailor applications to leverage maximum performance. Here's a guide on how to use Python to retrieve this information.
As long as you have a Google account, feel free to follow along in this reference notebook:
1. Starting with the System Information: platform and lsb_release.
The Python standard library has a module named platform which can provide a wealth of information about the system, OS, and its version.
uname = platform.uname()
print(f"System: {uname.system}")  # e.g. 'Windows', 'Linux', 'Darwin' for macOS
print(f"Node Name: {uname.node}")
print(f"Release: {uname.release}")  # e.g. '10' for Windows 10
print(f"Version: {uname.version}") # Detailed version information
print(f"Machine: {uname.machine}") # e.g. 'x86_64' for a 64-bit machine
print(f"Processor: {uname.processor}")  # e.g. 'Intel64 Family 6 Model 78 Stepping 3, GenuineIntel'


To get a bit more information about the OS, you can then use another built-in Python package called lsb_release.
import lsb_release
import pprint
pprint.pprint(lsb_release.get_os_release())


2. Extracting Detailed CPU and Hardware Information: cpuinfo
The py-cpuinfo and psutil modules offer detailed information about the CPU.
First, you need to ensure they are installed:
!pip install py-cpuinfo psutil
Now we can use them. The first quick check to see some high-level information about the CPUs available and their performance can be done through the use of psutil.
# number of cores
print("Physical cores:", psutil.cpu_count(logical=False))
print("Total cores:", psutil.cpu_count(logical=True))
# CPU frequencies
cpufreq = psutil.cpu_freq()
print(f"Max Frequency: {cpufreq.max:.2f}Mhz")
print(f"Min Frequency: {cpufreq.min:.2f}Mhz")
print(f"Current Frequency: {cpufreq.current:.2f}Mhz")
# CPU usage
print("CPU Usage Per Core:")
for i, percentage in enumerate(psutil.cpu_percent(percpu=True, interval=1)):
    print(f"Core {i}: {percentage}%")
print(f"Total CPU Usage: {psutil.cpu_percent()}%")


However, a more detailed look can help you understand which generation of hardware you are running on and the features available to ensure you're tapping into every bit of performance and potential software workload optimization available.
import cpuinfo
import pprint
my_cpuinfo = cpuinfo.get_cpu_info()
pprint.pprint(my_cpuinfo)


In the current environment I'm running on, I can see the hardware flags for avx and avx2, which means that I have Advanced Vector Extensions to accelerate vector computations common in AI and ML workloads. However, I don't see the flag for amx, which is for the Advanced Matrix Extensions that are only available on Intel's newest server platform at the time of this writing called Sapphire Rapids.
So how can we determine which platform we're running on? Unfortunately, there's no simple solution, but one way is to reference the family and model variables returned from cpuinfo. In the case where I'm running on a free CPU runtime, we can see that 'family': 6 and 'model': 79. With a quick online search, we can find a page like wikichip that shows us we are most likely using an Intel Broadwell Server.... these were released back in 2014 so we're definitely not getting the last 10 years of advancements in hardware and low-level software innovation.
Once I connect to a runtime with a connected GPU, I now see that I've been upgraded to 'family': 6 and 'model': 85 which is an Intel Skylake Server. Still not the latest Sapphire Rapids with AMX, but at least I've unlocked some additional AI/ML performance in this newer generation with all of the avx512 flags!
Not complaining here, just showing why it's important to see what's under the hood of these managed services. Google Colab is an amazing freemium service that utilizes what's left of GCP, so obviously they'd want to save the newest hardware for paying customers!
3. Retrieving System Memory Information: psutil
The psutil library is excellent for fetching a wide variety of system details, including memory info. This area is a bit more straightforward to determine:
# get the memory details
svmem = psutil.virtual_memory()
print(f"Total: {get_size(svmem.total)}")
print(f"Available: {get_size(svmem.available)}")
print(f"Used: {get_size(svmem.used)}")
print(f"Percentage: {svmem.percent}%")
The only catch is if you have swap memory. Don't worry about this error-ing if you're unsure, everything will return zeros if it doesn't exist.
# get the swap memory details (if exists)
swap = psutil.swap_memory()
print(f"Total: {get_size(swap.total)}")
print(f"Free: {get_size(swap.free)}")
print(f"Used: {get_size(swap.used)}")
print(f"Percentage: {swap.percent}%")


4. Extracting GPU Information: GPUtil
If you are working on tasks involving GPU computation, such as deep learning, knowing your GPU details can be critical.
Install the GPU package:
!pip install GPUtil
Retrieve GPU details:
import GPUtil
# GPU Information
GPUs = GPUtil.getGPUs()
gpulist=[]
for gpu in GPUs:
    print(gpu.name)
    print('gpu.id:', gpu.id)

    print ( 'total GPU:', gpu.memoryTotal)
    print(f"Memory free {gpu.memoryFree}MB")
    print ( 'GPU usage:', gpu.memoryUsed)
    print ( 'gpu use proportion:', gpu.memoryUtil * 100)
    print(str(gpu.temperature) + " C")

    gpulist.append([ gpu.id, gpu.memoryTotal, gpu.memoryUsed,gpu.memoryUtil * 100])
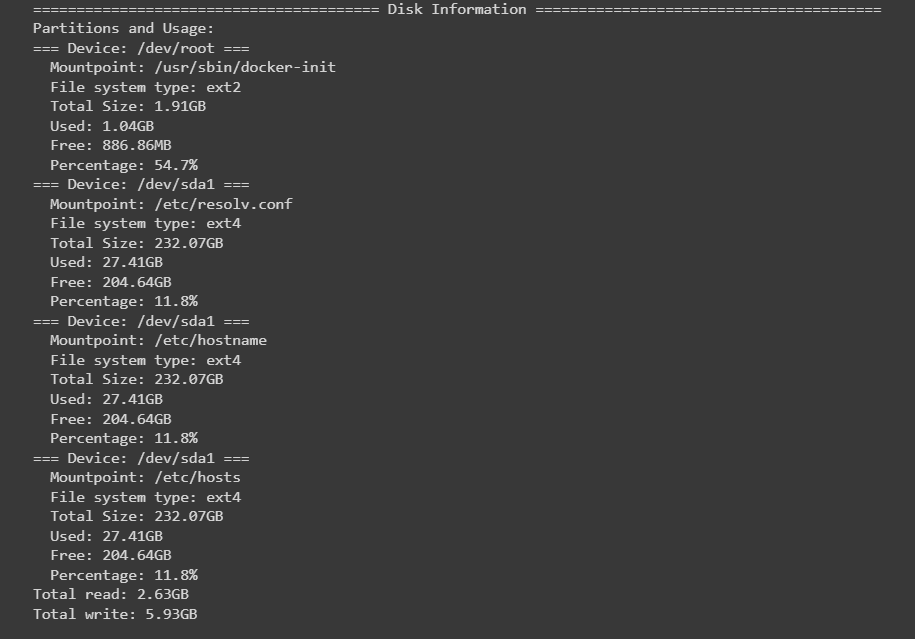
5. Disk Information using psutil
psutil can also provide disk usage and partition details:
# Disk Information
print("Partitions and Usage:")
# get all disk partitions
partitions = psutil.disk_partitions()
for partition in partitions:
    print(f"=== Device: {partition.device} ===")
    print(f"  Mountpoint: {partition.mountpoint}")
    print(f"  File system type: {partition.fstype}")
    try:
        partition_usage = psutil.disk_usage(partition.mountpoint)
    except PermissionError:
        # this can be catched due to the disk that
        # isn't ready
        continue
    print(f"  Total Size: {get_size(partition_usage.total)}")
    print(f"  Used: {get_size(partition_usage.used)}")
    print(f"  Free: {get_size(partition_usage.free)}")
    print(f"  Percentage: {partition_usage.percent}%")
# get IO statistics since boot
disk_io = psutil.disk_io_counters()
print(f"Total read: {get_size(disk_io.read_bytes)}")
print(f"Total write: {get_size(disk_io.write_bytes)}")


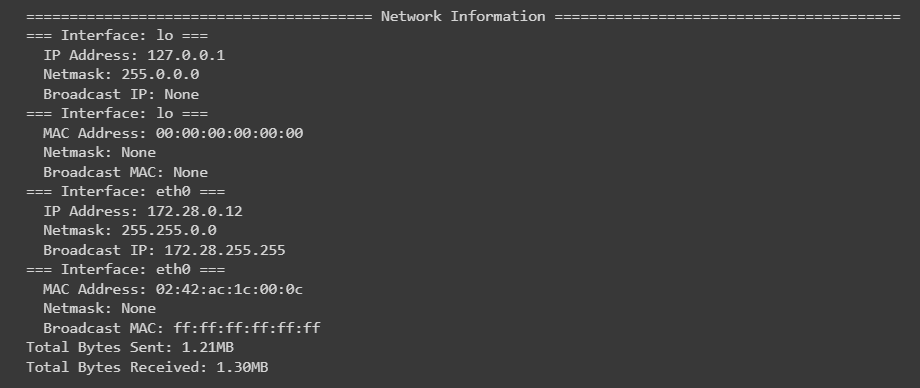
6. Network Information using psutil
psutil can also provide network details that you may be interested in especially when you have more control over how to connect to your system, you're looking to monitor the amount of network traffic coming into and going out of your system, or you're looking to connect multiple systems:
# get all network interfaces (virtual and physical)
if_addrs = psutil.net_if_addrs()
for interface_name, interface_addresses in if_addrs.items():
    for address in interface_addresses:
        print(f"=== Interface: {interface_name} ===")
        if str(address.family) == 'AddressFamily.AF_INET':
            print(f"  IP Address: {address.address}")
            print(f"  Netmask: {address.netmask}")
            print(f"  Broadcast IP: {address.broadcast}")
        elif str(address.family) == 'AddressFamily.AF_PACKET':
            print(f"  MAC Address: {address.address}")
            print(f"  Netmask: {address.netmask}")
            print(f"  Broadcast MAC: {address.broadcast}")
# get IO statistics since boot
net_io = psutil.net_io_counters()
print(f"Total Bytes Sent: {get_size(net_io.bytes_sent)}")
print(f"Total Bytes Received: {get_size(net_io.bytes_recv)}")


7. Preinstalled Python Packages: pkg_resource
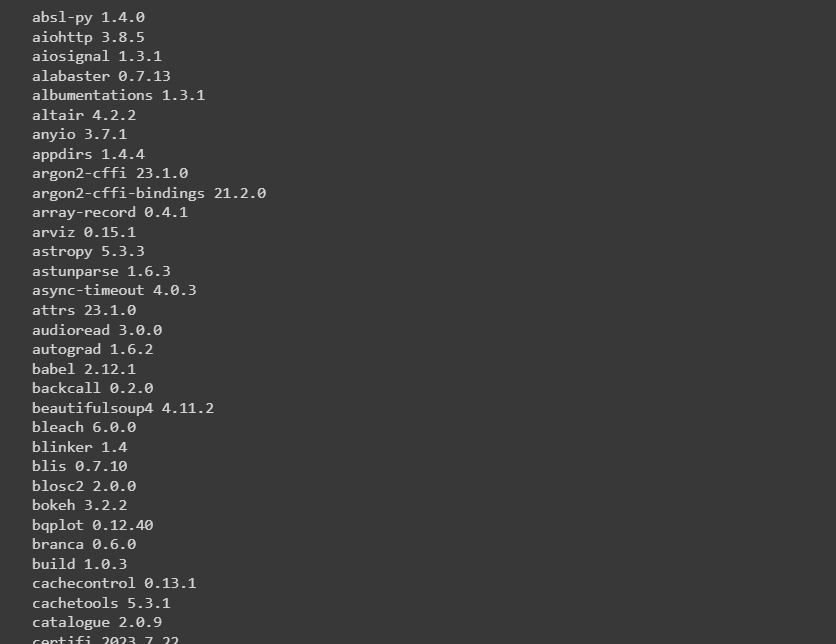
Another great habit to get into that will help reduce the size of your solutions and troubleshoot dependency errors as you build, is to review the environment's preinstalled Python packages. When you're using a managed service, it's easy to waste time hunting down issues that are solved by proper usage of virtual environments and package-lock files. One way to get familiar with what's preinstalled when you jump into a managed environment is by running the following code snippet:
from pkg_resources import working_set
libs = [x.project_name.lower()+' '+x.version for x in working_set]
for lib in sorted(libs):
  print(lib)


Now this lowercases all of the packages to sort them in alphabetical order for ease of browsing, but you can get rid of .lower() if you're concerned the packages aren't the same.
Why is this Important?
When you have a clear picture of your hardware and system specifications, you can:
- Optimize code for specific hardware (e.g., AVX & AMX accelerations in CPUs, GPU computation).
- Determine if parallelism or multiprocessing can be utilized based on the number of CPU cores.
- Make decisions about memory-intensive operations based on available RAM.
- Avoid bottlenecks related to disk I/O operations by understanding disk capacities.
Understanding the hardware helps in making your software efficient, robust, and, most importantly, performant. Don't neglect it!
Thanks for taking the time to read this overview, I hope it helps you learn something new about the importance of knowing what your software and solutions are running on, even in managed environments, and the community available to help you tackle any use case.
As always, feel free to reach out to just connect or let me know if I missed any great packages or insights that should be shared!
Amazing list of hardware feature flags and human-understandable descriptions, originally found here.
x86
(32-bit a.k.a. i386-i686 and 64-bit a.k.a. amd64. In other words, your workstation, laptop or server.)
FAQ: **Do I have…**
- 64-bit (x86_64/AMD64/Intel64)? **
lm** - Hardware virtualization (VMX/AMD-V)? **
vmx** (Intel), **svm** (AMD) - Accelerated AES (AES-NI)? **
aes** - TXT (TPM)? **
smx** - a hypervisor (announced as such)? **
hypervisor**
Most of the other features are only of interest to compiler or kernel authors.
All the flags
The full listing is in the kernel source, in the file arch/x86/include/asm/cpufeatures.h.
Intel-defined CPU features, CPUID level 0x00000001 (edx)
See also Wikipedia and table 2-27 in Intel Advanced Vector Extensions Programming Reference
fpu: Onboard FPU (floating point support)vme: Virtual 8086 mode enhancementsde: Debugging Extensions (CR4.DE)pse: Page Size Extensions (4MB memory pages)tsc: Time Stamp Counter (RDTSC)msr: Model-Specific Registers (RDMSR, WRMSR)pae: Physical Address Extensions (support for more than 4GB of RAM)mce: Machine Check Exceptioncx8: CMPXCHG8 instruction (64-bit compare-and-swap)apic: Onboard APICsep: SYSENTER/SYSEXITmtrr: Memory Type Range Registerspge: Page Global Enable (global bit in PDEs and PTEs)mca: Machine Check Architecturecmov: CMOV instructions (conditional move) (also FCMOV)pat: Page Attribute Tablepse36: 36-bit PSEs (huge pages)pn: Processor serial numberclflush: Cache Line Flush instructiondts: Debug Store (buffer for debugging and profiling instructions)acpi: ACPI via MSR (temperature monitoring and clock speed modulation)mmx: Multimedia Extensionsfxsr: FXSAVE/FXRSTOR, CR4.OSFXSRsse: Intel SSE vector instructionssse2: SSE2ss: CPU self snoopht: Hyper-Threading and/or multi-coretm: Automatic clock control (Thermal Monitor)ia64: Intel Itanium Architecture 64-bit (not to be confused with Intel's 64-bit x86 architecture with flagx86-64or "AMD64" bit indicated by flaglm)pbe: Pending Break Enable (PBE# pin) wakeup support
AMD-defined CPU features, CPUID level 0x80000001
See also Wikipedia and table 2-23 in Intel Advanced Vector Extensions Programming Reference
syscall: SYSCALL (Fast System Call) and SYSRET (Return From Fast System Call)mp: Multiprocessing Capable.nx: Execute Disablemmxext: AMD MMX extensionsfxsr_opt: FXSAVE/FXRSTOR optimizationspdpe1gb: One GB pages (allowshugepagesz=1G)rdtscp: Read Time-Stamp Counter and Processor IDlm: Long Mode (x86-64: amd64, also known as Intel 64, i.e. 64-bit capable)3dnowext: AMD 3DNow! extensions3dnow: 3DNow! (AMD vector instructions, competing with Intel's SSE1)
Transmeta-defined CPU features, CPUID level 0x80860001
recovery: CPU in recovery modelongrun: Longrun power controllrti: LongRun table interface
Other features, Linux-defined mapping
cxmmx: Cyrix MMX extensionsk6_mtrr: AMD K6 nonstandard MTRRscyrix_arr: Cyrix ARRs (= MTRRs)centaur_mcr: Centaur MCRs (= MTRRs)constant_tsc: TSC ticks at a constant rateup: SMP kernel running on UPart: Always-Running Timerarch_perfmon: Intel Architectural PerfMonpebs: Precise-Event Based Samplingbts: Branch Trace Storerep_good: rep microcode works wellacc_power: AMD accumulated power mechanismnopl: The NOPL (0F 1F) instructionsxtopology: cpu topology enum extensionstsc_reliable: TSC is known to be reliablenonstop_tsc: TSC does not stop in C statescpuid: CPU has CPUID instruction itselfextd_apicid: has extended APICID (8 bits)amd_dcm: multi-node processoraperfmperf: APERFMPERFeagerfpu: Non lazy FPU restorenonstop_tsc_s3: TSC doesn't stop in S3 statetsc_known_freq: TSC has known frequencymce_recovery: CPU has recoverable machine checks
Intel-defined CPU features, CPUID level 0x00000001 (ecx)
See also Wikipedia and table 2-26 in Intel Advanced Vector Extensions Programming Reference
pni: SSE-3 (“Prescott New Instructions”)pclmulqdq: Perform a Carry-Less Multiplication of Quadwordinstruction — accelerator for GCM)dtes64: 64-bit Debug Storemonitor: Monitor/Mwait support (Intel SSE3 supplements)ds_cpl: CPL Qual. Debug Storevmx: Hardware virtualization: Intel VMXsmx: Safer mode: TXT (TPM support)est: Enhanced SpeedSteptm2: Thermal Monitor 2ssse3: Supplemental SSE-3cid: Context IDsdbg: silicon debugfma: Fused multiply-addcx16: CMPXCHG16Bxtpr: Send Task Priority Messagespdcm: Performance Capabilitiespcid: Process Context Identifiersdca: Direct Cache Accesssse4_1: SSE-4.1sse4_2: SSE-4.2x2apic: x2APICmovbe: Move Data After Swapping Bytes instructionpopcnt: Return the Count of Number of Bits Set to 1instruction (Hamming weight, i.e. bit count)tsc_deadline_timer: Tsc deadline timeraes/aes-ni: Advanced Encryption Standard (New Instructions)xsave: Save Processor Extended States: also provides XGETBY,XRSTOR,XSETBYavx: Advanced Vector Extensionsf16c: 16-bit fp conversions (CVT16)rdrand: Read Random Number from hardware random number generator instructionhypervisor: Running on a hypervisor
VIA/Cyrix/Centaur-defined CPU features, CPUID level 0xC0000001
rng: Random Number Generator present (xstore)rng_en: Random Number Generator enabledace: on-CPU crypto (xcrypt)ace_en: on-CPU crypto enabledace2: Advanced Cryptography Engine v2ace2_en: ACE v2 enabledphe: PadLock Hash Enginephe_en: PHE enabledpmm: PadLock Montgomery Multiplierpmm_en: PMM enabled
More extended AMD flags: CPUID level 0x80000001, ecx
lahf_lm: Load AH from Flags (LAHF) and Store AH into Flags (SAHF) in long modecmp_legacy: If yes HyperThreading not validsvm: “Secure virtual machine”: AMD-Vextapic: Extended APIC spacecr8_legacy: CR8 in 32-bit modeabm: Advanced Bit Manipulationsse4a: SSE-4Amisalignsse: indicates if a general-protection exception (#GP) is generated when some legacy SSE instructions operate on unaligned data. Also depends on CR0 and Alignment Checking bit3dnowprefetch: 3DNow prefetch instructionsosvw: indicates OS Visible Workaround, which allows the OS to work around processor errata.ibs: Instruction Based Samplingxop: extended AVX instructionsskinit: SKINIT/STGI instructionswdt: Watchdog timerlwp: Light Weight Profilingfma4: 4 operands MAC instructionstce: translation cache extensionnodeid_msr: NodeId MSRtbm: Trailing Bit Manipulationtopoext: Topology Extensions CPUID leafsperfctr_core: Core Performance Counter Extensionsperfctr_nb: NB Performance Counter Extensionsbpext: data breakpoint extensionptsc: performance time-stamp counterperfctr_l2: L2 Performance Counter Extensionsmwaitx:MWAITextension (MONITORX/MWAITX)
Auxiliary flags: Linux defined - For features scattered in various CPUID levels
ring3mwait: Ring 3 MONITOR/MWAITcpuid_fault: Intel CPUID faultingcpb: AMD Core Performance Boostepb: IA32_ENERGY_PERF_BIAS supportcat_l3: Cache Allocation Technology L3cat_l2: Cache Allocation Technology L2cdp_l3: Code and Data Prioritization L3invpcid_single: effectivelyinvpcidandCR4.PCIDE=1hw_pstate: AMD HW-PStateproc_feedback: AMD ProcFeedbackInterfacesme: AMD Secure Memory Encryptionpti: Kernel Page Table Isolation (Kaiser)retpoline: Retpoline mitigation for Spectre variant 2 (indirect branches)retpoline_amd: AMD Retpoline mitigationintel_ppin: Intel Processor Inventory Numberavx512_4vnniw: AVX-512 Neural Network Instructionsavx512_4fmaps: AVX-512 Multiply Accumulation Single precisionmba: Memory Bandwidth Allocationrsb_ctxsw: Fill RSB on context switches
Virtualization flags: Linux defined
tpr_shadow: Intel TPR Shadowvnmi: Intel Virtual NMIflexpriority: Intel FlexPriorityept: Intel Extended Page Tablevpid: Intel Virtual Processor IDvmmcall: preferVMMCALLtoVMCALL
Intel-defined CPU features, CPUID level 0x00000007:0 (ebx)
fsgsbase: {RD/WR}{FS/GS}BASE instructionstsc_adjust: TSC adjustment MSRbmi1: 1st group bit manipulation extensionshle: Hardware Lock Elisionavx2: AVX2 instructionssmep: Supervisor Mode Execution Protectionbmi2: 2nd group bit manipulation extensionserms: Enhanced REP MOVSB/STOSBinvpcid: Invalidate Processor Context IDrtm: Restricted Transactional Memorycqm: Cache QoS Monitoringmpx: Memory Protection Extensionrdt_a: Resource Director Technology Allocationavx512f: AVX-512 foundationavx512dq: AVX-512 Double/Quad instructionsrdseed: The RDSEED instructionadx: The ADCX and ADOX instructionssmap: Supervisor Mode Access Preventionavx512ifma: AVX-512 Integer Fused Multiply Add instructionsclflushopt:CLFLUSHOPTinstructionclwb:CLWBinstructionintel_pt: Intel Processor Tracingavx512pf: AVX-512 Prefetchavx512er: AVX-512 Exponential and Reciprocalavx512cd: AVX-512 Conflict Detectionsha_ni: SHA1/SHA256 Instruction Extensionsavx512bw: AVX-512 Byte/Word instructionsavx512vl: AVX-512 128/256 Vector Length extensions
Extended state features, CPUID level 0x0000000d:1 (eax)
xsaveopt: OptimizedXSAVExsavec:XSAVECxgetbv1:XGETBVwith ECX = 1xsaves:XSAVES/XRSTORS
Intel-defined CPU QoS sub-leaf, CPUID level 0x0000000F:0 (edx)
cqm_llc: LLC QoS
Intel-defined CPU QoS sub-leaf, CPUID level 0x0000000F:1 (edx)
cqm_occup_llc: LLC occupancy monitoringcqm_mbm_total: LLC total MBM monitoringcqm_mbm_local: LLC local MBM monitoring
AMD-defined CPU features, CPUID level 0x80000008 (ebx)
clzero:CLZEROinstructionirperf: instructions retired performance counterxsaveerptr: Always save/restore FP error pointers
Thermal and Power Management leaf, CPUID level 0x00000006 (eax)
dtherm(formerlydts): digital thermal sensorida: Intel Dynamic Accelerationarat: Always Running APIC Timerpln: Intel Power Limit Notificationpts: Intel Package Thermal Statushwp: Intel Hardware P-stateshwp_notify: HWP notificationhwp_act_window: HWP Activity Windowhwp_epp: HWP Energy Performance Preferencehwp_pkg_req: HWP package-level request
AMD SVM Feature Identification, CPUID level 0x8000000a (edx)
npt: AMD Nested Page Table supportlbrv: AMD LBR Virtualization supportsvm_lock: AMD SVM locking MSRnrip_save: AMD SVM next_rip savetsc_scale: AMD TSC scaling supportvmcb_clean: AMD VMCB clean bits supportflushbyasid: AMD flush-by-ASID supportdecodeassists: AMD Decode Assists supportpausefilter: AMD filtered pause interceptpfthreshold: AMD pause filter thresholdavic: Virtual Interrupt Controllervmsave_vmload: Virtual VMSAVE VMLOADvgif: Virtual GIF
Intel-defined CPU features, CPUID level 0x00000007:0 (ecx)
avx512vbmi: AVX512 Vector Bit Manipulation instructionsumip: User Mode Instruction Protectionpku: Protection Keys for Userspaceospke: OS Protection Keys Enableavx512_vbmi2: Additional AVX512 Vector Bit Manipulation instructionsgfni: Galois Field New Instructionsvaes: Vector AESvpclmulqdq: Carry-Less Multiplication Double Quadwordavx512_vnni: Vector Neural Network Instructionsavx512_bitalg: VPOPCNT[B,W] and VPSHUF-BITQMB instructionsavx512_vpopcntdq: POPCNT for vectors of DW/QWla57: 5-level page tablesrdpid: RDPID instruction
AMD-defined CPU features, CPUID level 0x80000007 (ebx)
overflow_recov: MCA overflow recovery supportsuccor: uncorrectable error containment and recoverysmca: Scalable MCA
Detected CPU bugs (Linux-defined)
f00f: Intel F00Ffdiv: CPU FDIVcoma: Cyrix 6x86 comaamd_tlb_mmatch:tlb_mmatchAMD Erratum 383amd_apic_c1e:apic_c1eAMD Erratum 40011ap: Bad local APIC aka 11APfxsave_leak: FXSAVE leaks FOP/FIP/FOPclflush_monitor: AAI65, CLFLUSH required before MONITORsysret_ss_attrs: SYSRET doesn't fix up SS attrsespfix: "" IRET to 16-bit SS corrupts ESP/RSP high bitsnull_seg: Nulling a selector preserves the baseswapgs_fence: SWAPGS without input dep on GSmonitor: IPI required to wake up remote CPUamd_e400: CPU is among the affected by Erratum 400cpu_meltdown: CPU is affected by meltdown attack and needs kernel page table isolationspectre_v1: CPU is affected by Spectre variant 1 attack with conditional branchesspectre_v2: CPU is affected by Spectre variant 2 attack with indirect branchesspec_store_bypass: CPU is affected by the Speculative Store Bypass vulnerability (Spectre variant 4).
P.S. This listing was derived from arch/x86/include/asm/cpufeatures.h in the kernel source. The flags are listed in the same order as the source code. Please help by adding links to descriptions of features when they're missing, by writing a short description of features that have an unexpressive names, and by updating the list for new kernel versions. The current list is from Linux 4.15 plus some later additions.